creating an effective infographic
Source: HotButterStudio
|
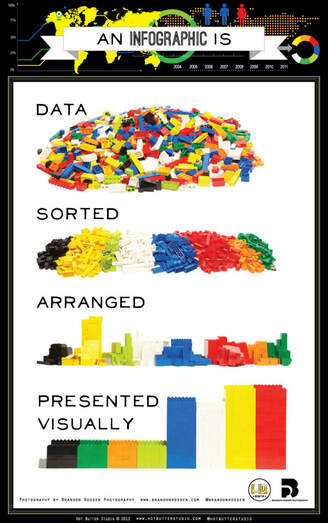
An infographic is a popular way to convey information.
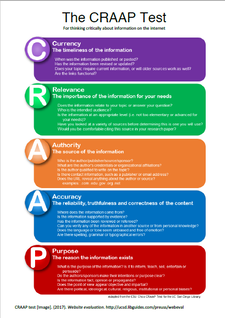
“Infographics are visual designs that help to explain complicated data in a simple way” (Smith, 2012) but simply putting words and pictures together doesn’t make your piece of work an infographic. A successful infographic should be:
|
|
Why not have a look at:
|
Step 1: research and gather your data
step 2: analyse your data
step 3: decide which type of infographic best suits your needs
step 4: draft your infographic
This part can either be done on paper, within a Word or Pages document or even within the infographic tool itself. step 5: select a tool to help design your infographic
There are a number of tools that can used to produce an infographic. Here are some of the most popular ones: step 6: gather responsibly sources images
When searching for images you need to remember:
To find images that are free to use why not look for Creative Commons material. Not sure what Creative Commons is? Have a look at the CC License Fact Sheet. Places to search for Creative Commons images: Other options step 7: take into account good design principles
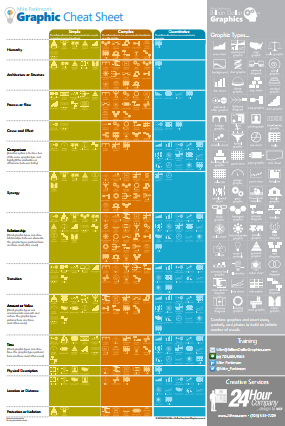
Overall, make sure you keep the same style through your infographic. Graphics
references
|